10.5 Data Collection Types and Resources
| Site: | Alma |
| Course: | TRIG Course- Alma College Winter 2015 |
| Book: | 10.5 Data Collection Types and Resources |
| Printed by: | Guest user |
| Date: | Sunday, March 15, 2026, 2:13 AM |
Description
(Detail potential data sources that gauge online testing readiness at the student level. Include technology and content readiness data sources.)
1. Explore Educational Data Types
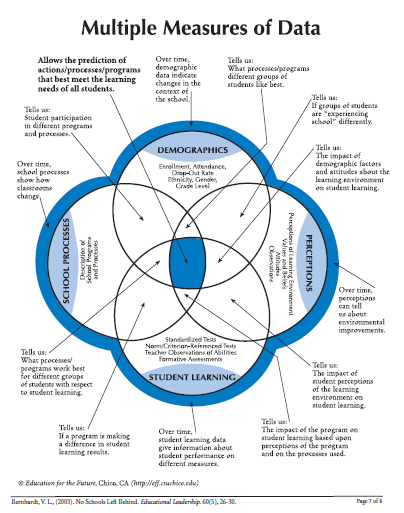
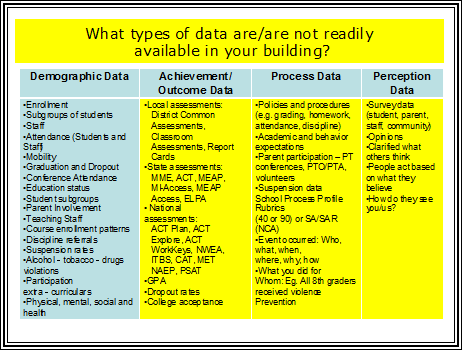
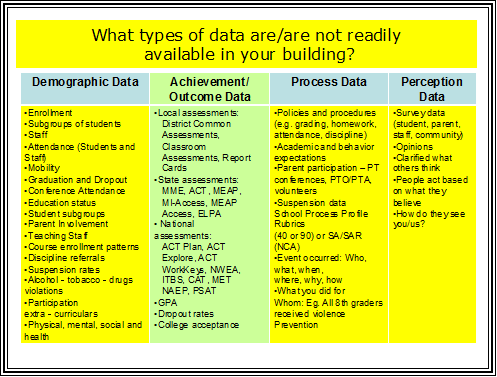
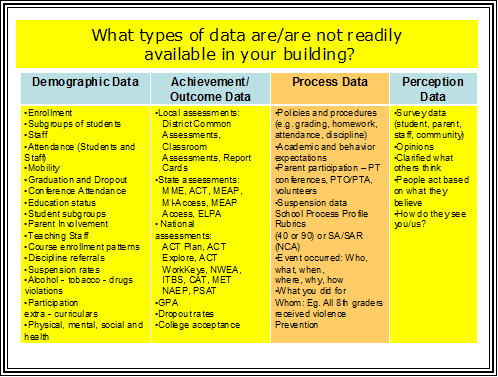
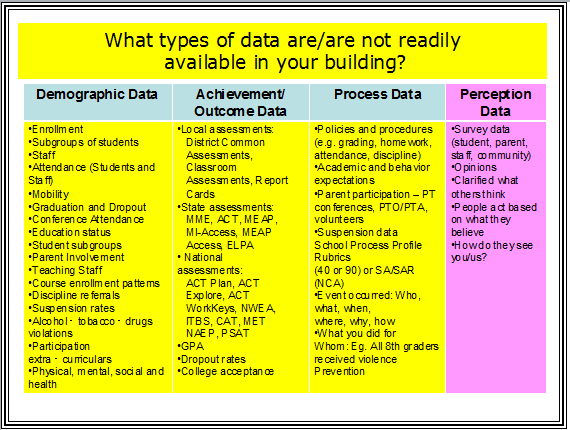
Based on the interview with your school improvement team, you have gathered information about the types of data collected for school improvement. Dr. Victoria Bernhardt has created categories for school data. In her work, she shows how gathering, intersecting and analyzing the four types of data provide a deeper understanding.
Before you begin the next section, read the article "No Schools Left Behind" by Dr. Victoria Bernhardt. As you move through this lesson, you should be able to differentiate between and amongst the data types, as well as how they intersect.
2. Data Collection for School Improvement
 |
|
||
 |
Carefully review the type of data Consider how your school improvement |
2.1. MISchoolData Introduction
In this module you will be utilizing MISchoolData to locate different types of data.
>If you are already familiar with MISchoolData.org, proceed to the next chapter.
>If you have never visited MISchoolData.org before, you may want to take a few moments to go through the following tutorial.
View the getting started video. For additional information, review the presentation "Introduction to MISchoolData".
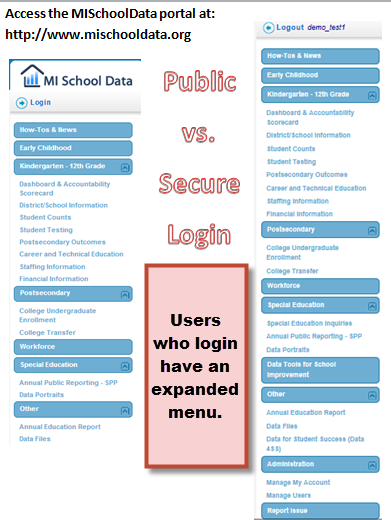
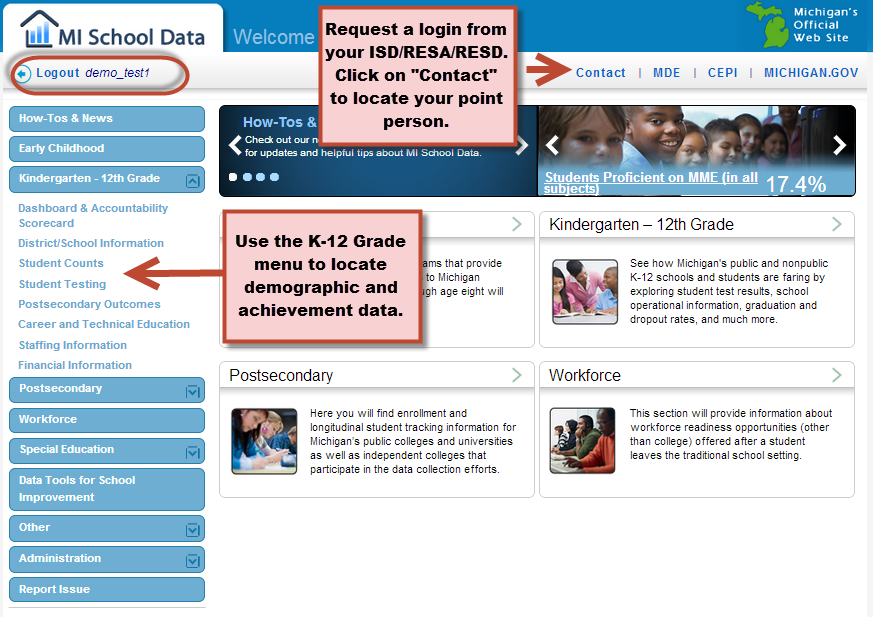
2.2. MISchoolData Logins
MISchoolData has both a public side and a secure side. Visitors to the web site who do not login will be able to see publicly shared information.
By requesting a login from your ISD/RESD/RESA, an educator will be given TEACHER LEVEL access.
All Michigan educators are encouraged to request a login to promote a culture of data inquiry and access.
2.3. MISchoolData: K-12 Dashboard
The Kindergarten - 12th Grade area of the portal contains a variety of information to assist in data collection.
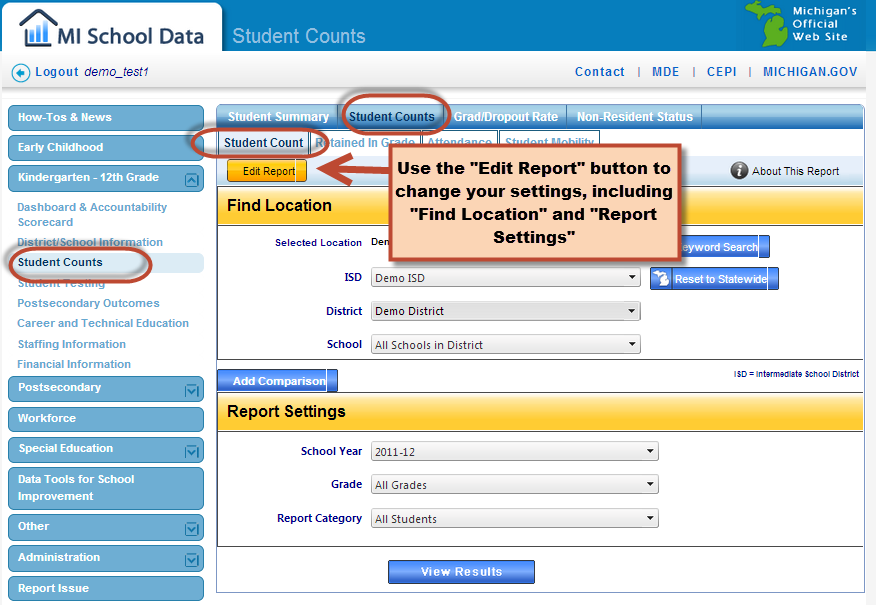
2.4. MISchoolData: K-12: Student Counts
Demographic data within MISchoolData is plentiful in the "Student Counts" menu.
Locate student counts, graduation/dropout rate, retentions, attendance, student mobility, and non-resident status. Use the "Edit Report" button to change report settings.
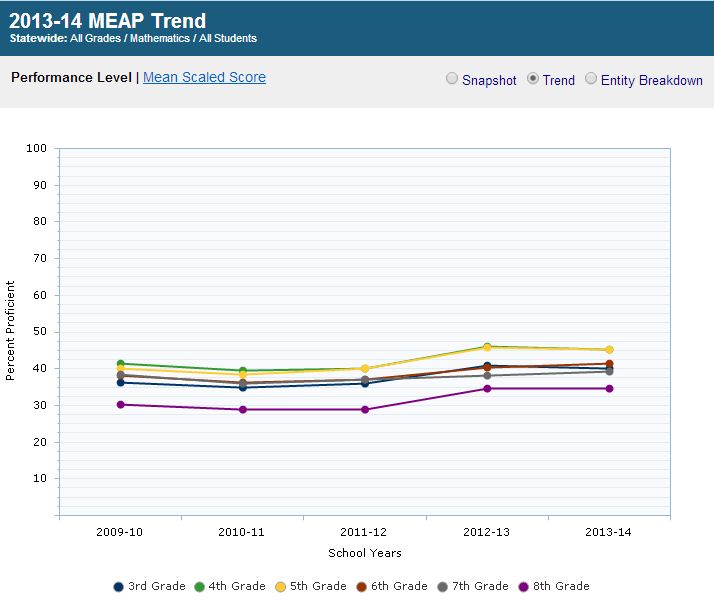
2.5. MISchoolData: K-12: Student Testing
Select the test (e.g. MEAP, MI-Access, MME, ACT College Readiness, or Students Not Tested).
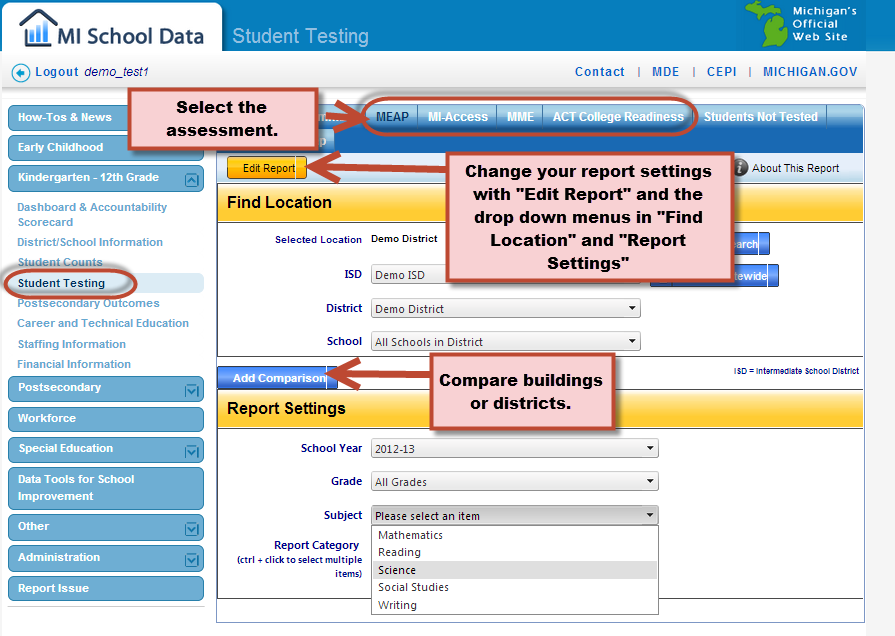
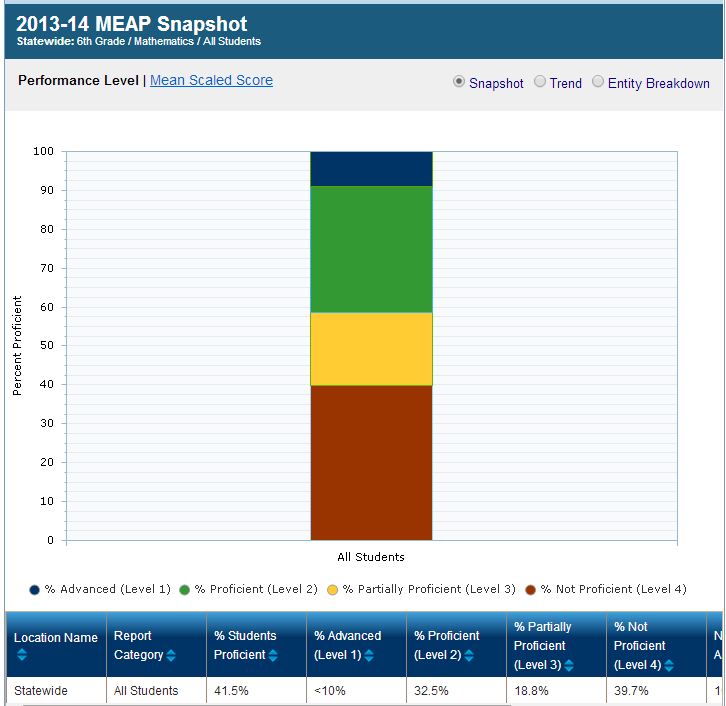
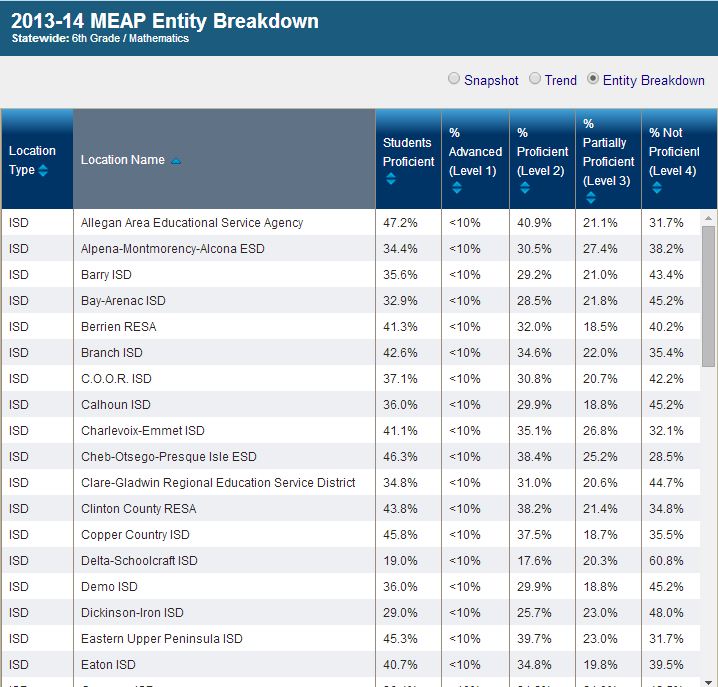
View the reports in a variety of ways: Snapshot, Trend, or Entity Breakdown.
| Snapshot View | Trend View | Entity Breakdown View |
 |
 |
 |
2.6. MISchoolData: Additional Resources
|
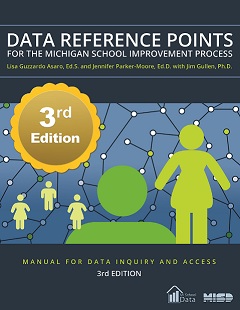
For a step-by-step guide to the MISchoolData portal, visit the Macomb Facilitators of School Improvement web site to download chapters of the book, "Data Reference Points for the Michigan School Improvement Process, 3rd. ed." |
|
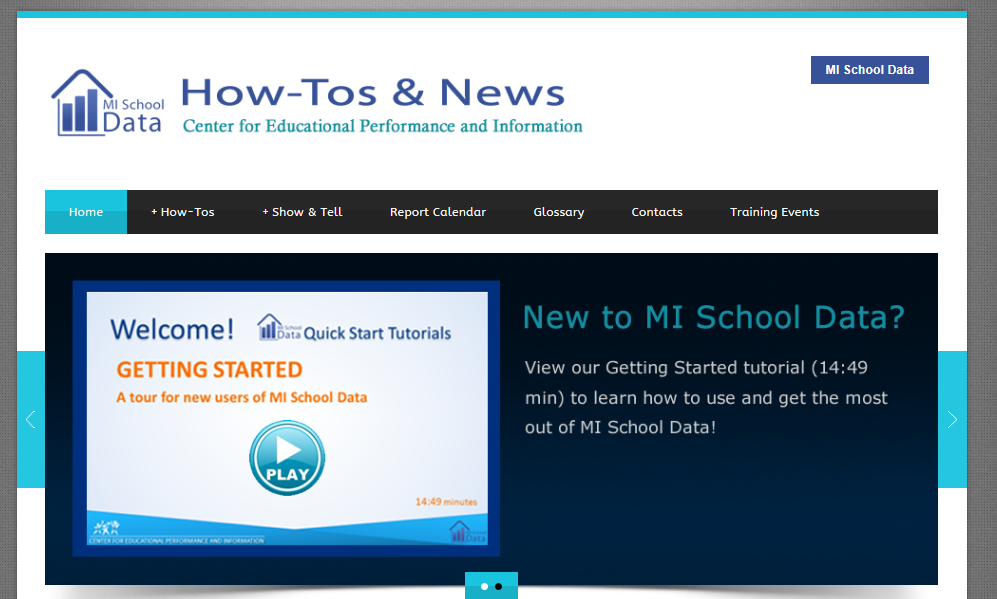
| For additional videos, tutorials, training, and contact information, visit the MISchoolData "News & How To's" site. |
|
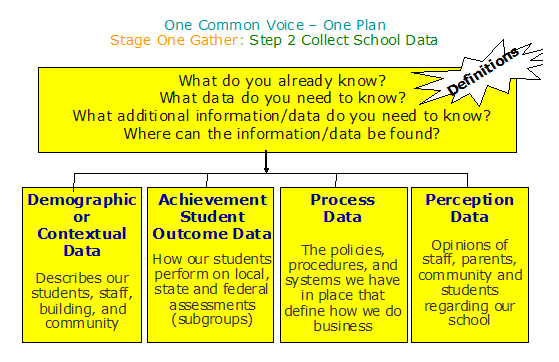
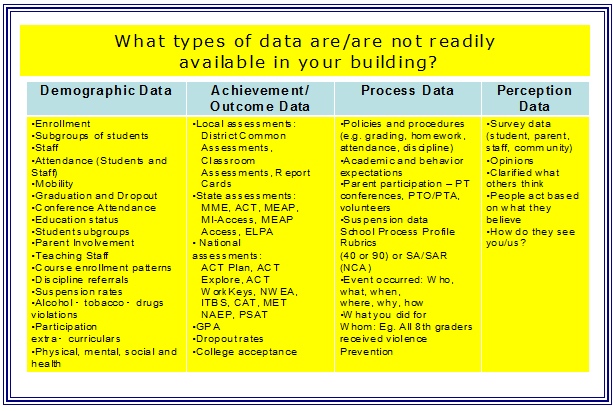
3. Demographic Data
The demographic data collected by a school building include information on students and staff. This includes enrollment, attendance, status, involvement, mobility, and participation rates for courses or programs. Some sources of demographic data include MISchoolData, a local data warehouse, a student information system, or other sources.
 |
|

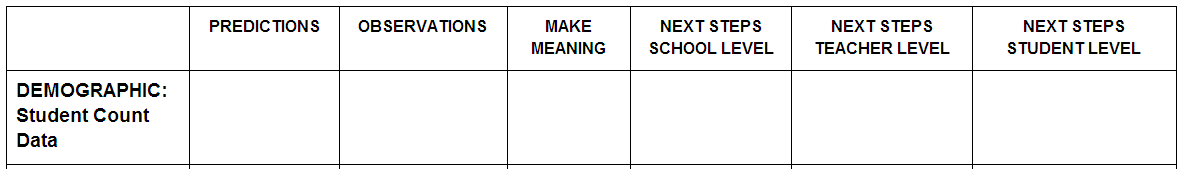
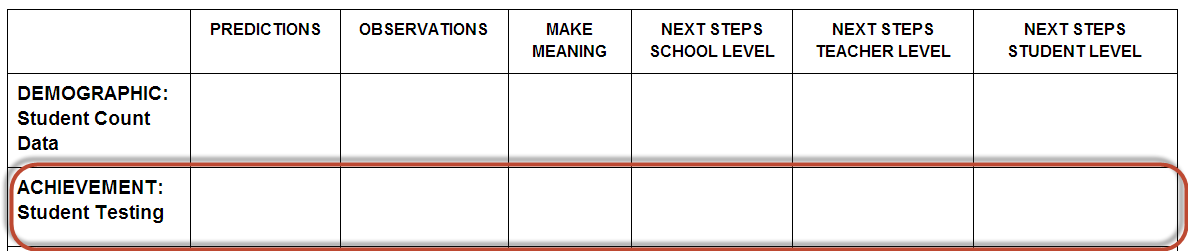
3.1. Digital Portfolio Activity: Dig Demographic Data
 Open your Portfolio and complete the following:
1. Complete the "Predictions" section about trends in Student Demographic Data for your school.
2. Go to www.mischooldata.org
3. Visit the "Kindergarten - 12th Grade" menu
4. Select "Student Counts"
5. Edit the "Find Location" and "Report Settings" to locate your school district. Run a report for all schools, all grades, and all students.
6. You may use the "Edit Report" button to change your settings.
7. Select the "Snapshot", "Trend", and/or "Entity Breakdown" views.
8. What do you notice about the trends in Student Counts? Complete the "Observations" section of your Portfolio.
9. Data Conference with a colleague(s) and complete the "Making Meaning" section of the Portfolio.
10. Brainstorm the student, teacher, and building level implications and complete the section called "Next Steps" in your Portfolio.
4. Achievement Data
Achievement data collected by a building may include student performance on state tests (e.g. MEAP, MME, MIAccess, MEAP-Access, etc.), or nationally normed tests (PLAN, Explore, NWEA, ACT, PSAT, ITBS, DIBELS, etc.). Local assessments can also be used to report achievement data. These could include grade level testing, common end-of-course assessments, performance on MLPP, DRA testing or other locally developed reading assessments.
Two great sources for student achievement data are a local data warehouse or MISchoolData.
|
|
 |
4.1. Digital Portfolio Activity: Dig Achievement Data

Open your Portfolio and complete the following:
1. Complete the "Predictions" section about trends in Student Achievement Data for your school.
2. Go to www.mischooldata.org
3. Visit the "Kindergarten - 12th Grade" menu
4. Select "Student Testing" and choose the tab "MEAP" or "MME" depending on your grade level.
5. Edit the "Find Location" and "Report Settings" to locate your school district. Select a building, grade level, most current year, and subject (e.g. Math).
6. You may use the "Edit Report" button to change your settings.
7. Select the "Snapshot", "Trend", and/or "Entity Breakdown" views.
8. What do you notice about the achievement scores in Student Testing? Complete the "Observations" section of your Portfolio.
9. Data Conference with a colleague(s) and complete the "Making Meaning" section of the Portfolio.
10. Brainstorm the student, teacher, and building level implications and complete the section called "Next Steps" in your Portfolio.
5. Process Data
Process data involves the reporting of "how we do business around here", or the rules, guidelines, and protocols in place to guide the building's operations.
Examine the Process of "Getting Tech Ready"
For the purposes of this module, you will use your interviews with your school improvement teams and the technology director/MTRAx information for your Process data.
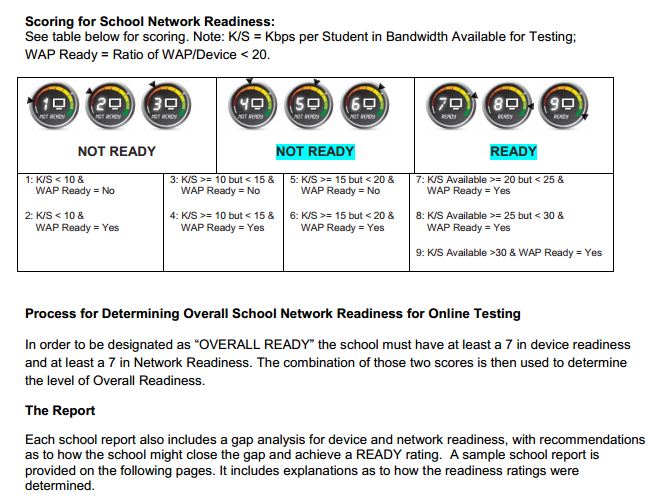
5.1. Process Data- MTRAx - Network / Infrastructure / Device Level
Schools in Michigan began participating in the Michigan Technology Readiness Survey (MTRAx) during the 2012-2013 academic year. Updates to the system now occur annually.
The three specific levels of technology readiness that the survey focused on were:
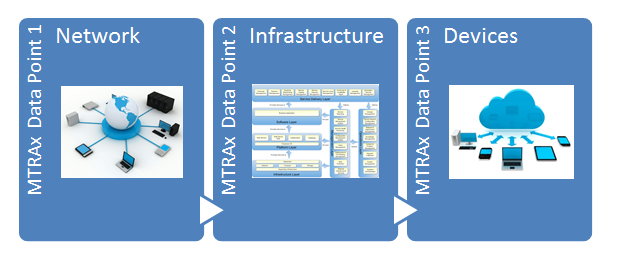
The outcomes of the survey have been provided to each district and are to be used as baseline data to determine which level(s) of technology readiness must be addressed prior to full implementation of the next generation of online assessments.

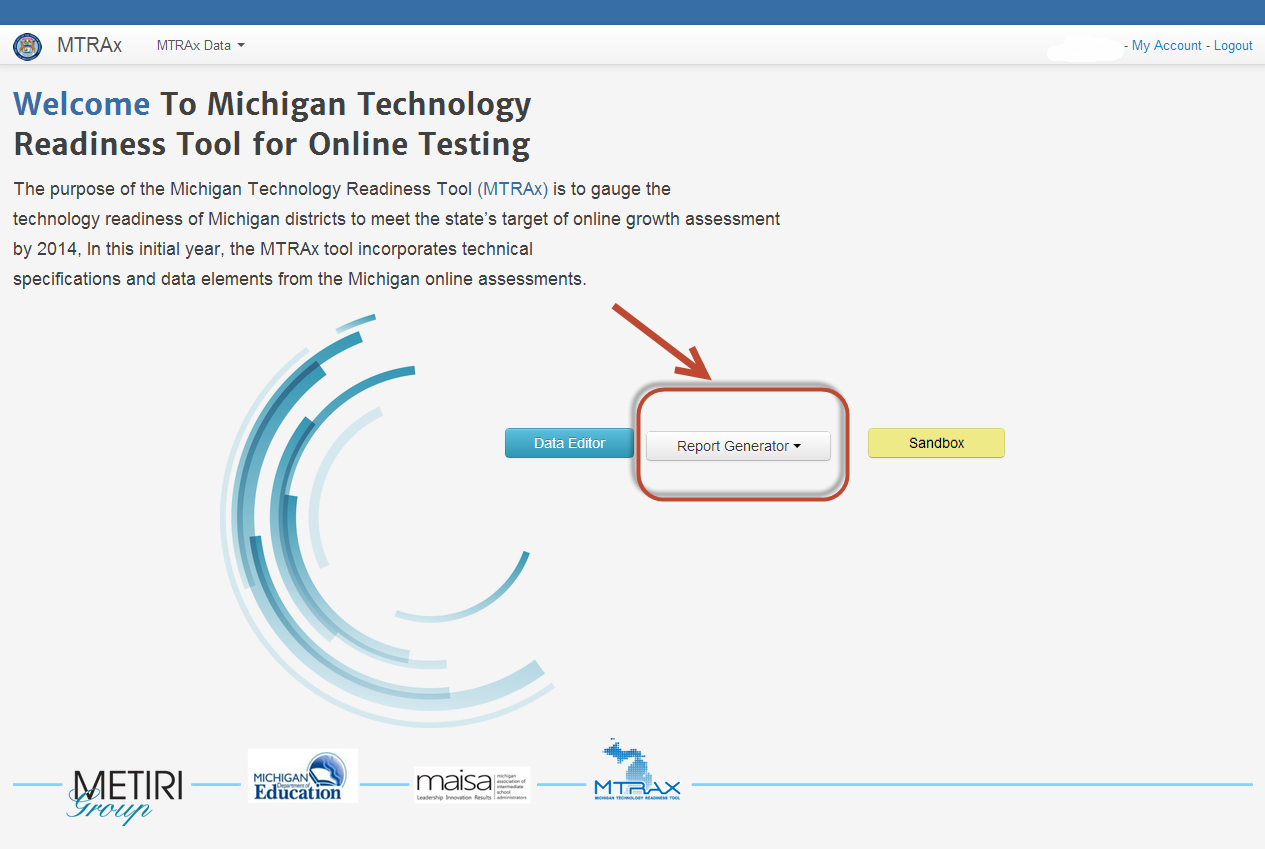
5.2. MTRAx Survey Data
It should be noted that the information in the 2012-2013 report represents a snapshot of relative readiness at the time the survey was conducted. Districts have since had the opportunity to upgrade their network, improve infrastructure and purchase new devices to increase readiness. Districts participated in another round of MTRAx reporting during the 2013-2014 school year to update their readiness indicators around network, infrastructure and devices.
Ask that your technology director share a copy of this report.
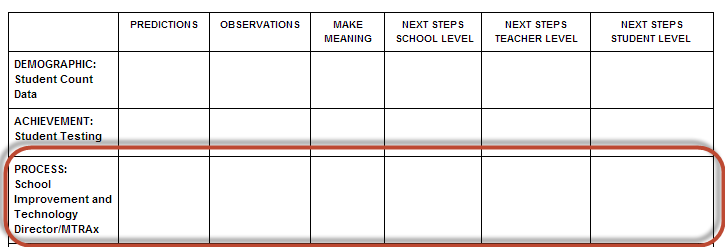
5.4. Digital Portfolio Activity: Dig Process Data

Open your Portfolio and complete the following:
1. Complete the "Predictions" section about your building's MTRAx report.
2. What do you notice about the network, device, and infrastructure readiness of your building? Complete the "Observations" section of your Portfolio.
3. Data Conference with a colleague(s) and complete the "Making Meaning" section of the Portfolio.
4. Brainstorm the student, teacher, and building level implications and complete the section called "Next Steps" in your Portfolio.
6. Perception Data
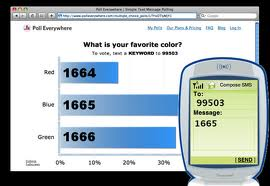
Perception data involves gathering the opinions, comments, and recommendations about our school building from stakeholders. These stakeholders include parents, teachers/staff, students and community members. There are a variety of tools used to collect this data, including the use of online assessment or survey tools like Socrative, GoSoapbox, PollEverywhere, Google Forms, and Survey Monkey that you learned about in Module 9..
 |
|

6.1. Creating a Perception Survey
Consider the perception data you could collect for your own classroom. Students, Parents, or Colleagues can share their perceptions to help you improve your instructional practice. Consider questions about technology use outside of the classroom, or how often stakeholders use your classroom website.
Create your own online survey gathering the perceptions about technology use of stakeholders. Consider using Google Forms with the following "How To" guide from "Data Reference Points for the Michigan School Improvement Process: Manual for Data Inquiry and Access, 3rd ed."

Click on the "Google Forms" image above to access the file.
Sample Survey for parents about technology use by student (feel free to edit/modify or create your own questions):
- How often you visit our classroom website?
- (choices could include never, daily, once a week, a couple times a week, etc.)
- (if you do not have a classroom website, substitute "school" website)
- How often does your child use the Internet at home?
- (choices could include never/no access, daily, once a week, a couple times a week, etc.)
- Does your child have access to a computer or portable mobile device at home?
- (choices could include yes, no)
- What is the primary use of technology by your child at home?
- (choices could include games, research, etc.)
- What comments or concerns do you have about student use of technology in the classroom?
- (this could be an open ended comment box to gather opinions
6.2. Perception Data Online Tools
![]()

![]()

These are a few sites that work well for collected survey data.
You are now ready to move on to the next activity: 10.6 Data Conferencing